When publishing a notebook, website, or dashboard, Inspect Viz plots are rendered by default as Jupyter Widgets that use JavaScript to provide various interactive features (tooltips, filtering, brushing, etc.). While this is the recommended way to publish Inspect Viz content, you can also choose to render content as static PNG images.
You might want do this if you are creating an Office or PDF document from a notebook, or want plots in a dashboard to be available even when disconnected from the Internet. Note however that rendering plots as PNG images does take longer than the native JavaScript output format, and that interactive features are not available in this mode.
Prerequisites
To create PNG output with Inspect Viz, first install the playwright Python package, which enables taking screenshots of web graphics using an embedded version of the Chromium web browser. You can do this as follows:
pip install playwrightplaywright install
Standalone
Use the write_png() function to save a stanalone PNG version of any plot. For example:
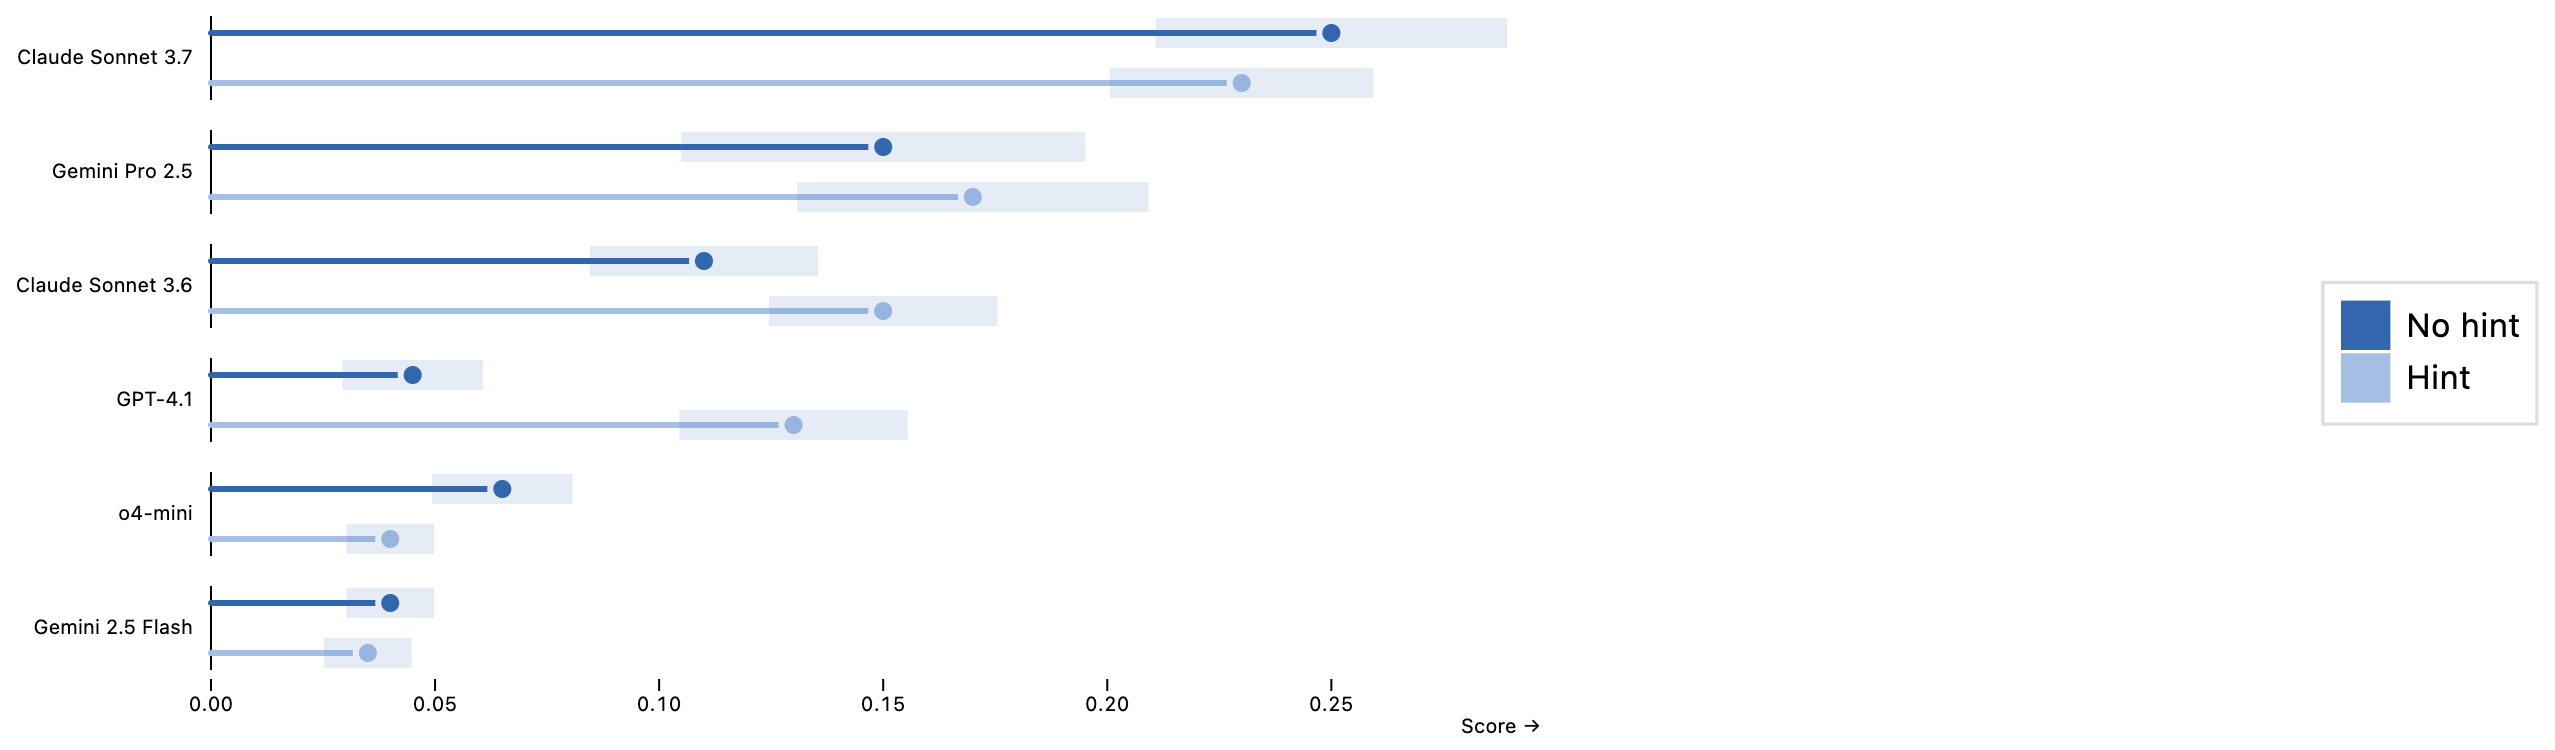
When your plots are embedded in a notebook or website, use the global output_format option to specify that you’d like to render them in PNG format. For example, the plot below is rendered as a static PNG graphic:
from inspect_viz import Data, optionsfrom inspect_viz.view import scores_by_factor# set 'png' as default output formatoptions.output_format ="png"# render plotevals = Data.from_file("evals-hint.parquet")scores_by_factor(evals, "task_arg_hint", ("No hint", "Hint"))
1
Set the global options.output_format option to render all plots in a notebook or Quarto document as static PNG images.
You can also do this for a single plot or set of plots using options_context():
from inspect_viz import options_contextwith options_context(output_format="png"):# plot code here
Note that when rendering a PDF document with Quarto, the output format is automatically set to “png” (as PDFs can’t ever include interactive JavaScript content).
PNG Fallback
Inspect Viz plots can also be rendered in a hybrid mode where a static PNG is embedded as a fallback and the interactive widget is overlaid on top once the JavaScript pipeline loads. If anything in the pipeline fails — for example, the user is on a restrictive network that blocks the jsDelivr CDN, or DuckDB-WASM can’t initialize — the PNG remains visible and the page stays readable.
This is especially valuable for sites that need to degrade gracefully in corporate networks, archival contexts, or offline viewing.
Enabling Fallback
The hybrid mode is opt-in. The cleanest way to enable it for production renders — without affecting quarto preview / dev iteration — is via a Quarto profile that sets the INSPECT_VIZ_OUTPUT_FORMAT environment variable.
Add an _environment-publish file at the root of your Quarto project:
_environment-publish
INSPECT_VIZ_OUTPUT_FORMAT=js+png
Then activate the publish profile when you’re ready to ship. The --profile flag works for both quarto render (build locally) and quarto publish (build + deploy):
# build the site locallyquarto render --profile publish# build and deploy in one step (Quarto Pub, GitHub Pages, Netlify, etc.)quarto publish --profile publish
During quarto preview (or a plain quarto render / quarto publish with no profile) the env var isn’t applied, so no PNG fallbacks are generated and dev iteration stays fast. Only your published build pays the per-plot Playwright cost.
You can also enable it ad-hoc with the env var directly:
INSPECT_VIZ_OUTPUT_FORMAT=js+png quarto render
Or programmatically in a notebook / document with options.output_format = "js+png" or options_context(output_format="js+png").
Widgets that contain inputs (tables, selects, checkbox groups, etc.) are skipped — a static picture of an interactive control isn’t a useful fallback — and those widgets render with the standard loading shimmer.