Plots
Overview
There are several ways to publish plots created with Inspect Viz:
Use the write_png() function to create an image for use in a document or presentation.
Use the write_html() function to create a standalone HTML file.
Create and share a Jupyter notebook with the plot.
Embed the plot in a website or dashboard.
This article will cover the first two options for sharing standalone plots—the Notebooks, Websites, and Dashboards articles will cover the other possibilities.
Plot as Image
Use the write_png() function to save a PNG version of any plot.
The write_png() function requires that you install the playwright Python package, which enables taking screenshots of web graphics using an embedded version of the Chromium web browser. You can do this as follows:
pip install playwright
playwright install
To create a plot and export it as a PNG:
from inspect_viz import Data
from inspect_viz.mark import dot
from inspect_viz.plot import plot, write_png
penguins = Data.from_file("penguins.parquet")
pl = plot(
dot(penguins, x="body_mass", y="flipper_length",
stroke="species", symbol="species"),
legend="symbol",
grid=True
)
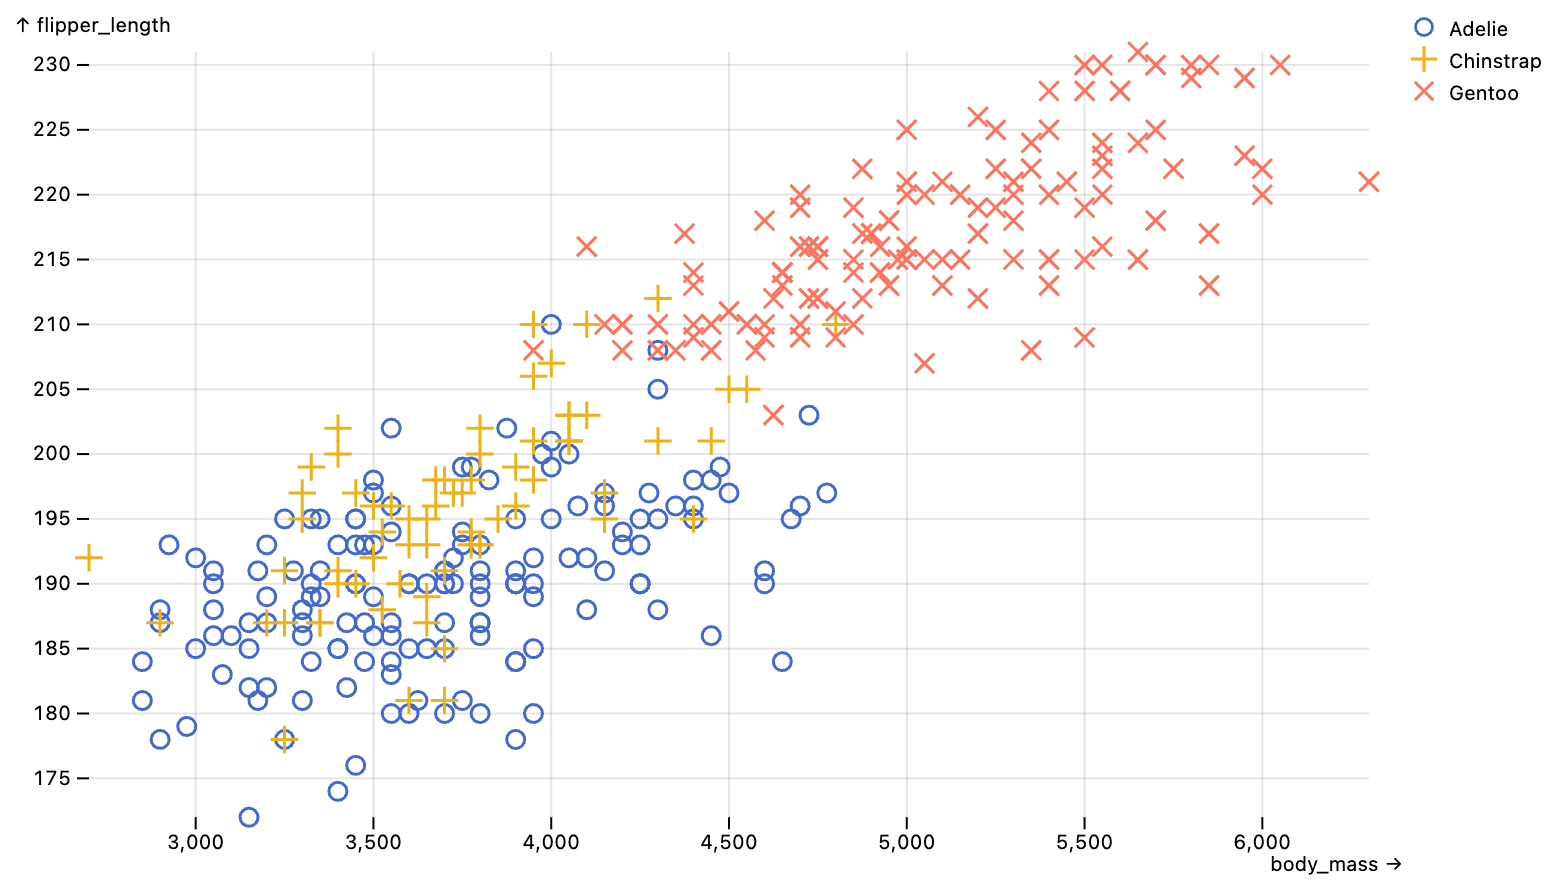
write_png("penguins.png", pl)Here is the plot that was written (note that since this plot is a static PNG file rather than a JavaScript widget it does not have tooltips):
Plot Size
You can control the size of the image written by specifying the width and height directly in the call to plot(). For example:
pl = plot(
    dot(penguins, x="body_mass", y="flipper_length",
        stroke="species", symbol="species"),
    legend="symbol",
    grid=True,
    width=900,
    height=400
)
Export Options
There are a couple of other options that can be used when exporting plots to PNG:
| Option | Description |
|---|---|
scale |
Device scale to capture plot at. Use 2 (the default) for retina quality images suitable for high resolution displays or print output) |
padding |
Padding (in pixels) to add around exported plot. Defaults to 8 pixels. |
Plot as HTML
You can also create an HTML version of a plot using the write_html() function. For example:
from inspect_viz import Data
from inspect_viz.mark import dot
from inspect_viz.plot import plot, write_html

penguins = Data.from_file("penguins.parquet")

pl = plot(
    dot(penguins, x="body_mass", y="flipper_length",
        stroke="species", symbol="species"),
    legend="symbol",
    grid=True
)

write_html("penguins.html", pl)
Unlike with write_png(), the exported HTML plot retains all interactive features (tooltips, filters, etc.). In some cases you might therefore also include inputs with your plot. For example:
pl = vconcat(
   select(penguins, label="Species", column="species"),
   plot(
      dot(penguins, x="body_mass", y="flipper_length",
          stroke="species", symbol="species"),
      legend="symbol",
      color_domain="fixed"
   )
)

write_html("penguins.html", pl)